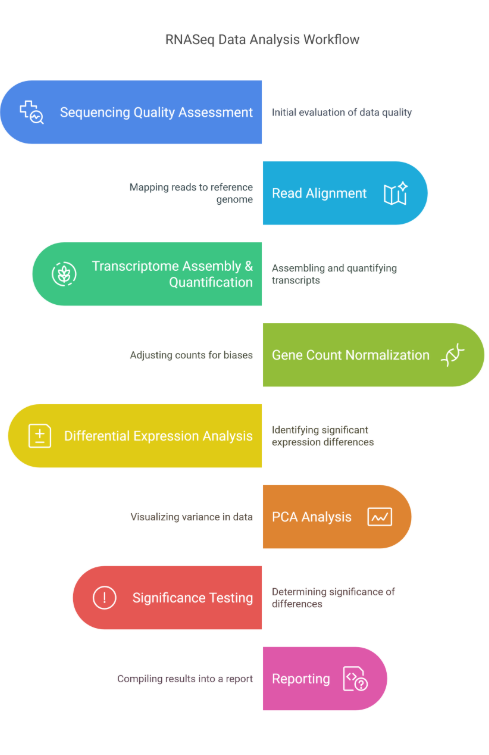
The standard analysis includes the following steps
-
Quality assessment of sequencing data, including evaluation of read quality, adapter trimming, and removal of low-quality bases
-
Alignment of reads to a reference genome, utilizing a splice aware aligner to ensure accurate mapping to the reference genome.
-
Assembly and quantification of transcripts, including identification of transcripts based on the known transcriptome models and estimation of gene expression levels
-
Normalization of gene counts, using methods such as TMM (trimmed mean of M-values) or DESeq2 to account for library size and sequencing depth
-
Identification of differentially expressed genes, using statistical methods such as edgeR or DESeq2 to detect significant changes in gene expression
-
Principal component analysis (PCA) to visualize sample relationships and identify patterns in gene expression
-
Significance testing to determine statistical significance of differentially expressed genes
-
Generation of detailed reports and visualizations, including heatmaps, volcano plots, and various QC metrics.
.
RNASeq data analysis service is designed to provide a comprehensive and efficient analysis of RNASeq data, with the option to add a data consultation for personalized guidance and support. Our team of bioinformatics experts will work closely with you to ensure that your analysis meets your specific research goals and requirements.
Deliverables:
-
Raw Sequencing Reads (FASTQ): Original raw sequencing data.
-
Genome Alignments (BAM): Alignment files in BAM format, providing the genomic coordinates of each read.
-
Gene Count Tables (TSV): A table of gene counts for each sample.
-
PCA Plots (PNG): Principal Component Analysis plots for quality control and visualization of sample relationships.
-
Volcano Plots (PNG): Volcano plots to visualize the relationship between fold change and statistical significance for each gene.
-
Fold Change Tables (TSV): Tables containing fold change values for each gene.
-
Significantly Expressed Genes (TSV): A list of genes that are significantly differentially expressed based on specified criteria.
-
Analysis Summary Report (HTML): A comprehensive report summarizing the analysis methods, parameters, and key findings.
Optional & Advanced Analysis
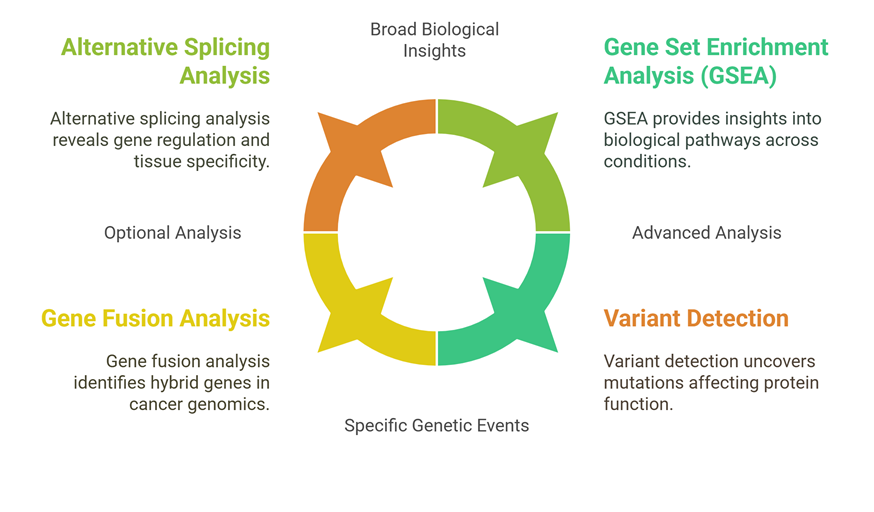
Optional Analysis
In addition to the standard analysis, several optional analyses are available, including:
Alternative splicing (AS) analysis: This analysis is available for designs with replicates in a case vs. control setup and provides a detailed view of the alternative splicing events that occur in the samples.
Deliverables: List of alternative splicing events in TSV format.
Gene Fusion Analysis: This analysis is available for single sample onwards and provides a detailed view of the gene fusions that occur in the samples.
Deliverables: List of gene fusions in TSV format.
Variant detection and its effect on protein alteration: This analysis is available for single sample onwards and provides a detailed view of the variants that occur in the samples and their effect on protein function.
Deliverables: List of variants in VCF format.
Advanced Analysis
Gene Set Enrichment Analysis (GSEA): This advanced bioinformatics analysis service utilizes Gene Set Enrichment Analysis (GSEA) to identify biological pathways and gene sets that are significantly enriched in differentially expressed genes. This analysis provides a deeper understanding of the biological processes and pathways that are affected by the changes in gene expression.
The GSEA report and results provide a comprehensive overview of the enriched gene sets and pathways, allowing for a more detailed interpretation of the biological significance of the results.
Deliverables:
- GSEA report in HTML format, including:
- Enriched gene sets and pathways
- Gene set enrichment scores and p-values
- Biological process and pathway annotations
- Heatmap visualization of enriched gene sets
- GSEA results in TSV format, including:
- Enriched gene sets and pathways
- Gene set enrichment scores and p-values
- Biological process and pathway annotations